
Market Update
October 21, 2021
Hope. Fear. Risk. Greed. As humans and investors, we deploy these emotions every time we make a significant decision. While the extremes are not diametrically opposed, they often keep us from making the logical decision…something harkening back to the incredibly useful ”fight or flight” brains we developed over the millennia. Fear kept us cautious (and alive) while hearing a rustle in the forest, whereas hope and greed encouraged us to plan, adapt, and store food for upcoming winters.
Yet as the world and our risks have evolved, our brains have not necessarily adapted at the same speed, and we tend to extrapolate the recent experience far more than the math itself would suggest. As a potentially prescient example, in the latter stages of an economic boom, investors are more likely to feel confident (and occasionally greedy) and are more likely to feel the fear of missing out. Therefore, on average, they buy and borrow more, and that is often the wrong decision at precisely the wrong time. Yet in the early stages of an economic recovery, investors still remember the pain of recent losses and fear weighs heavily. As such, investors borrow and purchase less and often miss out on the early gains of recovery.
Much of this occurs because humans often extrapolate the recent past into their expectation for the future…and that extrapolation is often too short-sighted to be useful...or at least beneficial.
Fast forward, and in many ways, it seems we face more risks today than ever before. COVID-19. Slowing growth. Inflation. Unemployment. Home prices at record highs. Used cars at unheard-of prices. Political collaboration at seemingly all-time lows. And on and on and on.
Using one economic lens, we could argue the economic expansion is about to end, and using another lens, we could just as easily argue we are just near the beginning of economic expansion. One economist will just as vigorously argue that our monetary policy is going to ruin the value of the U.S. dollar and inflation is certain, while a similarly well-trained and vehement economist will argue that monetary policy is no longer relevant and inflation is transitory at best.
What, therefore, is an average investor to do? Who are we to believe? One belief would lead to very different investment decisions than another.
And yet, here is the point. Every market, since the creation of markets, has held risk. There is literally not a moment in which a market does not expose the buyers and sellers to some form of risk. If you believe a market is risk-free, then the market is likely not understood. We, as investors, lend our capital to companies (as an example) that strive, but do not guarantee, to compensate us for giving them our capital. Most of the time that works, but occasionally, it does not.
Thus, let us use these risks for good and not evil. Our job, in many ways, is to fundamentally understand what the current risks are and how those risks can inform our framework for thinking about markets. Risk mitigation is, crucially, about building portfolios that strive to prevent damage from risks not yet contemplated. In order to do that well, we must, therefore, explore the risks that do exist and allow those to educate us about what could come.
Therefore, for today, let’s explore two of the current more notable risks: COVID-19 progression, and real estate.
With that, let us begin.
Clearly there is no such thing as “victory” because we are far from eradicating this virus, but progress is being made and the second explosion seems to be quieting. Before I explore those changes, let us take stock of the numbers thus far.
As of Oct. 20:
❖ There are now more than 240 million people worldwide who have had confirmed COVID-19 infections (nearly 3% of the world’s population).
❖ There are nearly 45 million Americans who have had confirmed COVID-19 infections (roughly 14% of the United States population).
❖ There have been nearly 5 million deaths attributable directly to the COVID-19 virus, and more than 744,000 of those occurred in the United States.
At the same time, we now have more than 6.6 billion vaccinations deployed worldwide, including more than 700 million in the last month alone. Truly remarkable numbers.
Perhaps interestingly (disturbingly), markets have recently become more immune to COVID-19 fluctuations…other than the direct impact the pandemic has on economic statistics. Regardless, the growth curves give us a good indication of what direction we are headed as COVID-19 tends to trend (as most exponential growth curves do). This brings us to Chart 1.
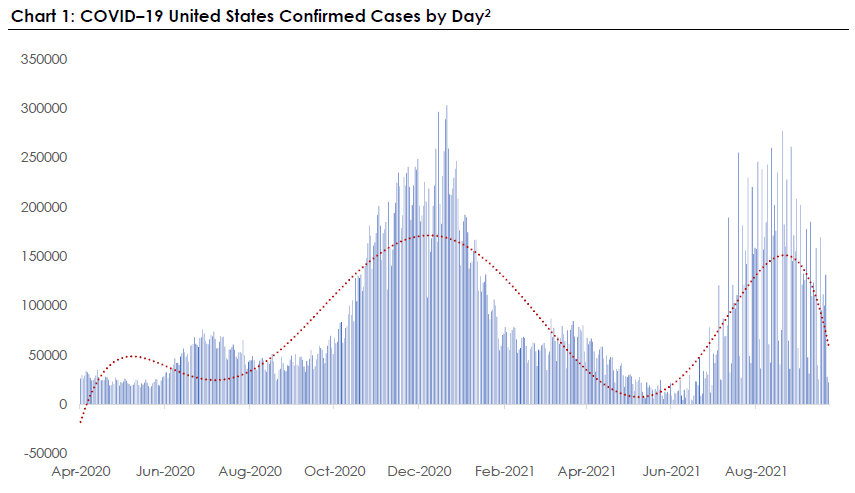
As Chart 1 demonstrates, the delta variant explosion that began in July quickly accelerated to hundreds of thousands of cases per day in the United States, and again, as did the first explosion, has since slowed. While virologists are still unclear exactly why this occurs (similar patterns exist in other countries as well), it is clear the cycle tends to last two to four months, and we are now (finally) on the download slope of the latest expansion.
As I have argued before, unfortunately the death curve tends to follow the case curve, and this brings us to Chart 2.
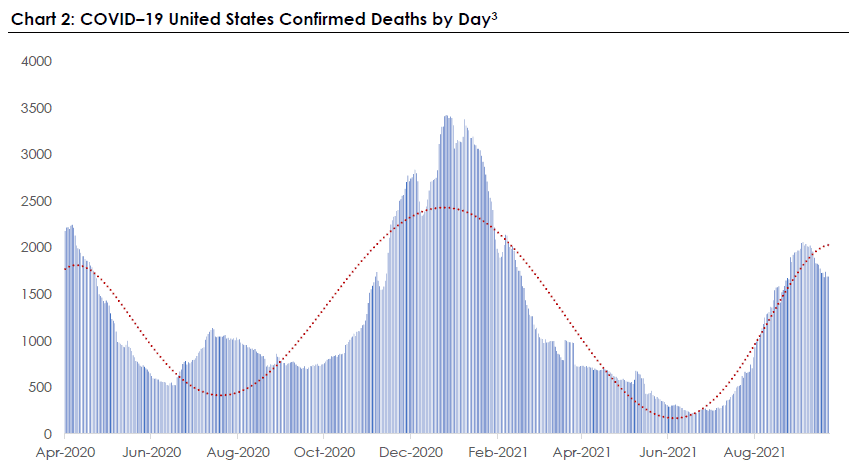
Thankfully the daily death tally never reached the levels at the end of 2020, but the most recent expansion is clear…as is the beginning of the contraction. Vaccination rates and better understanding have clearly helped mitigate the damage, but the damage was obviously far worse than desired.
Lastly, and more related to markets, we are following the growth curves slowly. Markets often discount levels, but focus intensely on change, and COVID-19 growth rates seem to follow a similar pattern.
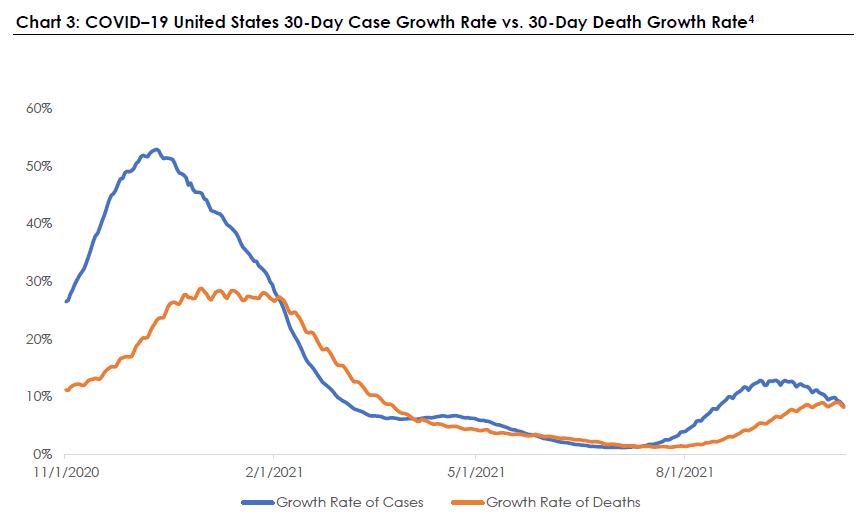
I believe there are several important takeaways from this chart. First, the growth rate expansion from the delta variant was much lower than previous growth rates. From a pure mathematical perspective, this is very important and will continue to help mitigate the impact. Second, the death growth rates trailed the case rates (as they did last time) but stayed much shallower and began to fall quicker than the last expansion. While attribution is always difficult, much of this progress is clearly a result of the widespread vaccination adoption. This progress should be lauded (and give us hope).
In summary, we continue to make progress and yet we continue to (unfortunately) be forced to find ways to co-exist with this frustratingly resilient virus.
We’ll continue to watch closely.
Section 2: Real Estate
If there’s one word I could limit the use of – it would be “unprecedented.” “We live in unprecedented times,” “this virus is unprecedented,” “capital markets have had unprecedented moves,” “monetary stimulus is in unprecedented territory.” After all, I’m a historian at heart and I tend to believe incentives drive behavior, and most of history is humans acting on incentives. I also believe those incentives haven’t changed for thousands of years. Said another way, if we can understand incentives, we can begin to understand human behavior. As such, the only logical extension of that logic is to believe that most of what we are seeing “rhymes” with what we have seen before, but yes, of course the details are different.
Which leads me to couch my previously planned hyperbolic statement as: “the recent moves in real estate are unprecedented…at least for 30 years.” Grant me that dear reader.
First, let’s start with some fundamentals. The esteemed Robert Shiller and Karl Case came up with a clever way to measure home prices in the 1980s. While the details (and some of their clever tricks) are important, let’s stick with broad brush strokes. In short, the index looks at 20 major metropolitan areas around the country and measures the price of homes that have sold twice. In other words, a new home doesn’t enter the calculation, but a home that sold 10 years ago and then again last week does. It’s a clever way of ensuring that the data is generally reliable.
Every month the prices of actual sales are retrieved and calculated. Then, month after month, we can use those changes to look at the level of home prices and how fast (or slow) prices are moving on average. This brings us to Chart 4.
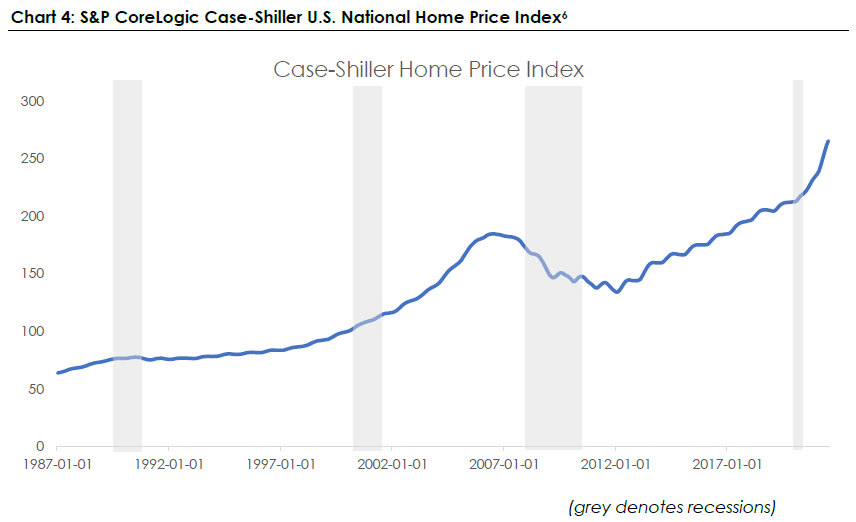
Note. The S&P CoreLogic Case-Shiller Home Price Indices are the leading measures of U.S. residential real estate prices, tracking changes in the value of residential real estate nationally.
As most homeowners have experienced, the chart goes from bottom left to upper right. Home prices, nationally and in aggregate, have gone up over the past 30 years. Yes, they have come down occasionally, but they generally recovered and, with the tailwind of a very helpful Federal Reserve, home prices have in fact done quite well.
Additionally, the astute observer may notice that the top right increase in home prices looks quite steep. This brings us to Chart 5.
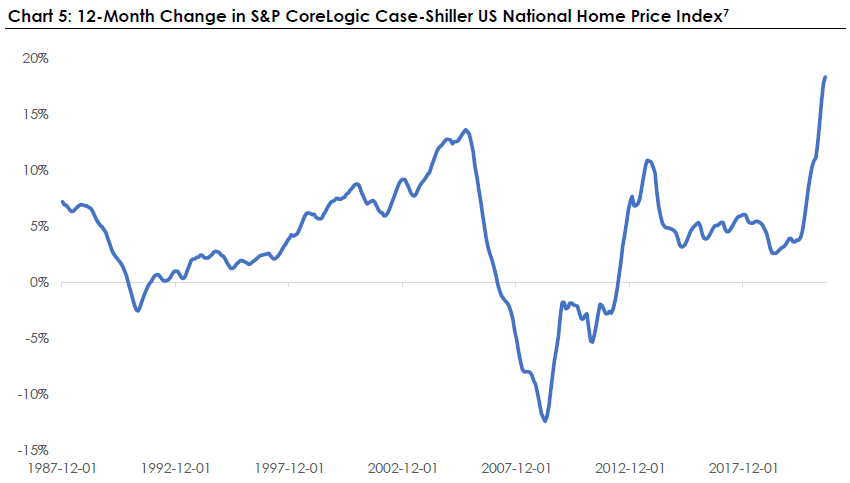
Chart 5 takes the same underlying data from Chart 4, but simply measures the percentage change over 12 months. This lens can therefore show us how much things have really changed and how those changes compare to history.
And here’s the point—at least over the past 30 years—there has never been a year-over-year change in real estate this large. It is…in a word…unprecedented.
Perhaps the interesting question is why?
While there is never going to be precision when understanding why prices move over an entire nation, there are some clear contributors. First, the Federal Reserve has literally (with the help of its friends at the Treasury) printed trillions of dollars out of thin air. If I own a house that is priced in dollars (as U.S. houses are), and there are now many more dollars, by definition, the value of those dollars goes down and the value of my house goes up. Second, the 10-year U.S. Treasury Rate (the primary rate that is utilized when determining mortgage rates) has continued on a steady decline since the early 1980s. This makes home prices less expensive and makes home buyers more likely to buy more expensive homes. And third, related to the first and second, equity markets have exploded since the March 2020 lows, and those that are fortunate enough to own equities are now feeling wealthier than ever, and are therefore more likely to borrow more and purchase more (stocks, houses, goods, and the like).
What, therefore, is the average investor to do? Home prices are up, stock prices are up, prices, in fact, of many goods are up.
In a word, caution is key. In the latter stages of economic booms many investors forget about the risks and often rationalize purchases and borrowing that, with the benefit of hindsight, are often too risky.
Risks are everywhere right now. Inflation. Dollar depreciation. Expensive markets. Poor yielding cash.
The short term is impossible to predict, therefore, it is wise to focus on what can be controlled. All markets have risk; all markets have danger. It is those who remain prudent and vigilant and resist the urge to chase the short term who increase the odds of reaching their financial objectives.
As always, we remain at your service, and we’ll continue watching these things closely. Please let us or your financial professional know how we can serve you.
Daken J. Vanderburg, CFA
Head of Investments, Wealth Management
MML Investors Services
1. Source: Johns Hopkins University, as of Oct. 20, 2021 https://www.arcgis.com/apps/opsdashboard/index.html#/bda7594740fd40299423467b48e9ecf6
2. Sources: https://ourworldindata.org/coronavirus, as of Oct. 20, 2021
3. https://www.spglobal.com/spdji/en/documents/methodologies/methodology-sp-corelogic-cs-home-price-indices.pdf
4. Sources: St. Louis Federal Reserve as of Oct. 20, 2021
Asset allocation and diversification does not guarantee a profit or protect against loss in declining markets. There is no guarantee that a diversified portfolio will outperform a non-diversified portfolio or that diversification among asset classes will reduce risk. Investing involves risk, including the possible loss of principal. There are no guarantees an investment’s stated objective will be achieved.
This material does not constitute a recommendation to engage in or refrain from a particular course of action. The information within has not been tailored for any individual. The opinions expressed herein are those of Daken J. Vanderburg, CFA as of the date of writing and are subject to change. MassMutual Trust Company, FSB (MassMutual Trust) and MML Investors Services provide this article for informational purposes, and does not make any representations as to the accuracy or effectiveness of its content s. Mr. Vanderburg is an employee of MassMutual Trust and MML Investors Services, and any comments, opinions or facts listed are those of Mr. Vanderburg. MassMutual Trust and MML Investors Services, LLC (MMLIS) are subsidiaries of Massachusetts Mutual Life Insurance Company (MassMutual).
This commentary is brought to you courtesy of MassMutual Trust and MML Investors Services, LLC (Member FINRA, Member SIPC). Past performance is not indicative of future performance. An index is unmanaged and one cannot invest directly in an index. Material discussed is meant for informational purposes only and it is not to be construed as specific tax, legal, or investment advice. Although the information has been gathered from sources believed to be reliable, it is not guaranteed or independently verified Please note that individual situations can vary, therefore, the information should be relied upon when coordinated with individual professional advice. Clients must rely upon his or her own financial professional before making decisions with respect to these matters. This material may contain forward looking statements that are subject to certain risks and uncertainties. Actual results, performance, or achievements may differ materially from those expressed or implied.
Securities, investment advisory, and wealth management solutions offered by MML Investors Services, LLC member SIPC a registered broker-dealer and a Registered Investment Adviser.

